
Bet analytics built for serious bettors
Win rate alone lies. Bet Journal's bet analytics break down ROI by sport, bet type and odds range — so you see where your edge actually lives.
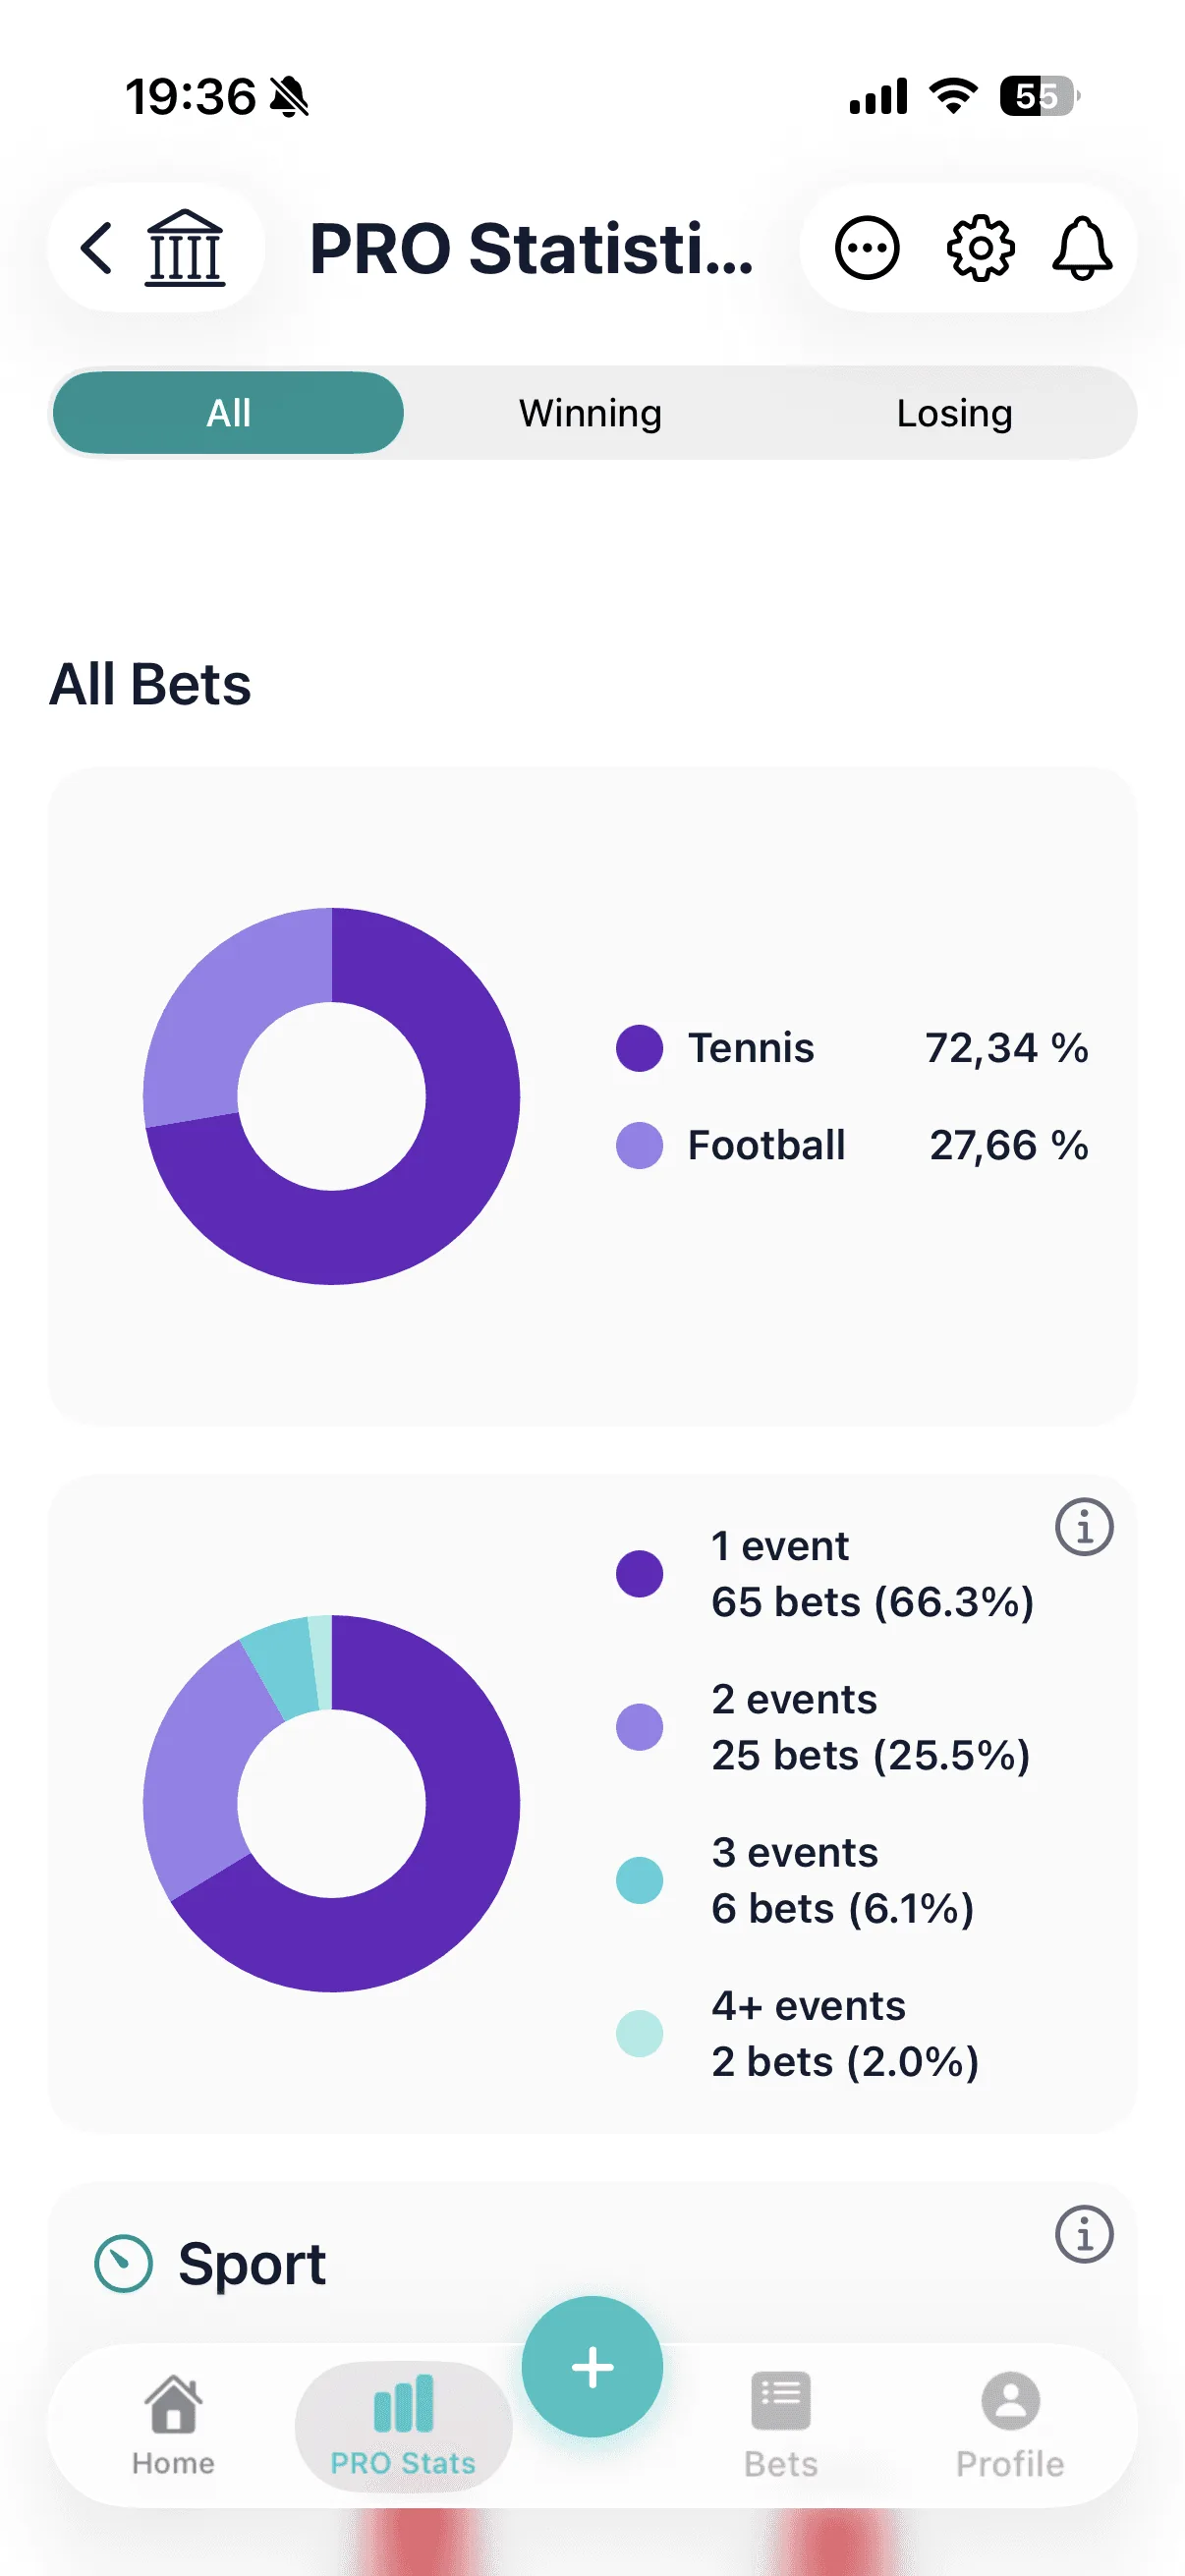
Generic bet trackers show a W-L record. Bet Journal's bet analytics answer the questions sharp bettors actually ask: which leagues pay you, which odds ranges bleed units, and whether you're improving month over month.
What is bet analytics?
Bet analytics is the review side of bet tracking. Once every wager is logged, analytics slice the record by sport, market, bet type, odds range and time, so you can see which parts of your betting make money and which quietly cost it. A W-L record tells you whether you won. Analytics tell you why, and what to change.
ROI by sport, bet type and odds
Filter your entire history by NFL, NBA, soccer, props, parlays or singles. See ROI and win rate for each slice without building a pivot table. Most bettors discover their "best sport" was a story they told themselves — the data tells a different one.
The bet analytics that matter
- ROI (yield): profit divided by total staked. The one number that says whether a segment is worth betting. Try the ROI calculator to see what a win rate earns at your odds.
- Win rate vs break-even: 55% sounds good until you see your average odds need 58% to break even. Analytics put the two side by side.
- Units won or lost: results in units stay comparable when your stake changes.
- Streaks and bounce-back rate: how you perform after a loss. A falling bounce-back rate is often tilt showing up in the numbers.
- Drawdown: the deepest drop from a bankroll peak, which tells you whether your staking survives a normal bad run.
Profit calendar and bankroll charts
Visualize cumulative units over time, spot drawdowns before they become disasters, and celebrate streaks that prove your process is working. Bankroll progression ties directly to every logged bet.
Performance insights and streaks
Smart reminders nudge you to log bets and review performance. Streak tracking keeps the habit alive. Bounce-back analytics show how you recover (or spiral) after losses — critical for mindset and stake sizing.
How to use bet analytics: a 15-minute monthly review
- Pick the window. The last 30 or 90 days, plus all-time for context.
- Sort sports and leagues by ROI. Look for segments with enough bets to matter and a clearly negative ROI.
- Check odds ranges. Many bettors win on short prices and lose on longshots, or the reverse. Find your band.
- Compare bet types. Singles vs parlays vs props. Parlays are where hidden leaks most often live.
- Look at the days after a loss. Stake size and bounce-back rate show whether you chase.
- Decide: cut, shrink or keep. Drop or reduce stakes on segments that lose over a meaningful sample. Keep what works.
- Write one rule for next month, for example "no parlays over three legs", and check it at the next review.
What the numbers often reveal
Patterns like these come up again and again once bettors look at their own data. The examples are illustrative, not real user results:
- Up overall, but the profit comes from one league while the league you bet most is slightly negative.
- A strong record on favourites hidden by small, frequent losses on longshot parlays.
- Stakes that creep up after losing days, turning a flat month into a losing one.
More in what bet tracking data reveals and how bet tracking improves your ROI.
Bet analytics app vs spreadsheet
| Question | Spreadsheet | Bet Journal |
|---|---|---|
| ROI by sport or league | Pivot table you build and maintain | Automatic |
| ROI by odds range | Custom formulas and bands | Automatic |
| Parlays vs singles | Manual tagging | Automatic by bet type |
| Profit calendar and streaks | Rarely built | Built in |
| Logging on a phone | Slow | Magic Upload, voice or quick entry |
Already have a spreadsheet? Bet Journal imports your Excel history. See Bet Journal vs spreadsheet.
Magic Upload + analytics
Analytics are only as good as your data. Magic Upload reads betslip screenshots so logging takes seconds, not minutes. Consistent data in, reliable bet analytics out.
Free core stats, PRO deep dives
Every user gets core bet tracking and stats free, plus a PRO trial for the full analytics suite: unlimited bankrolls, advanced breakdowns, calendars and graphs. No spreadsheet required.
Frequently asked questions
What is bet analytics?
Bet analytics means analysing your logged bets by sport, market, bet type, odds range and time to find where you make or lose money. It goes beyond win rate to ROI, units, streaks and drawdowns.
Which betting stats should I track?
ROI (profit divided by total staked) by sport, bet type and odds range, units won or lost, win rate against your break-even rate, and how you perform after losses.
How many bets do I need before analytics are reliable?
You can spot patterns after about 50 bets, but ROI needs a few hundred bets per segment before it is trustworthy. Judge each sport or market on its own sample.
Is Bet Journal's bet analytics free?
Core stats are free, and every new user gets a free PRO trial. PRO unlocks the full analytics suite: ROI by sport, bet type and odds range, calendars, graphs and unlimited bankrolls.
Can I analyse bets from any sportsbook?
Yes. Bet Journal works with any sportsbook in any country, because bets are logged manually, with Magic Upload from a betslip screenshot, by voice, or imported from Excel.
See your numbers clearly.
Download the bet tracking app built for analytics-first bettors.
New to tracking? Start with our bet tracking guide or read how bet tracking data exposes hidden patterns.